Best of GPN24

My picks from the Gulaschprogrammiernacht 24 in Karlsruhe.

Comparing the efficiency of an older Model 3 without heat pump versus a Model Y with one.
Of course the Model Y data isn’t really representative yet — the sample distance is still too short. But when comparing consumption at colder temperatures, the Model Y is surprisingly more efficient than the Model 3 (even accounting for size and weight). In the upper temperature range, our data barely shows this — which might point to a small heat pump effect. But I also drove some motorway stretches in summer (visible in the average speed), which distorts the picture by raising consumption.
Result: It simply doesn’t get cold enough here for the heat pump advantage to show clearly. (The heat pump reportedly has an effect around -10°C.) The Model Y is also more efficient at higher temperatures, where the heat pump can’t be a factor.
This topic has been discussed in the Tesla forum too, with mixed opinions. I found this thread interesting:
https://tff-forum.de/t/model3-mit-waermepumpe-vs-model3-ohne-waermepumpe-video/90076
Video:
https://youtu.be/8-H5lI60R9M?t=721
Conclusion: 2–3 kWh less consumption per 100 km with heat pump. So roughly 30 km more range per full charge at motorway speeds. Not negligible, but less than you’d think.
And of course the reference among YouTubers: Bjørn Nyland. He does the most rigorous tests and has also covered the heat pump:
https://www.youtube.com/watch?v=GRubEJh_5gs
If consumption matters to you, it’s better to pay attention to acceleration and top speed — that has a much bigger impact. The recommended motorway speed for the Model 3 is around 150 km/h. I don’t stick to that though — the driving fun matters more to me. I only slow down slightly (no speeds above 150) if I’m trying to just reach a preferred Supercharger and avoid an inconvenient charging stop.
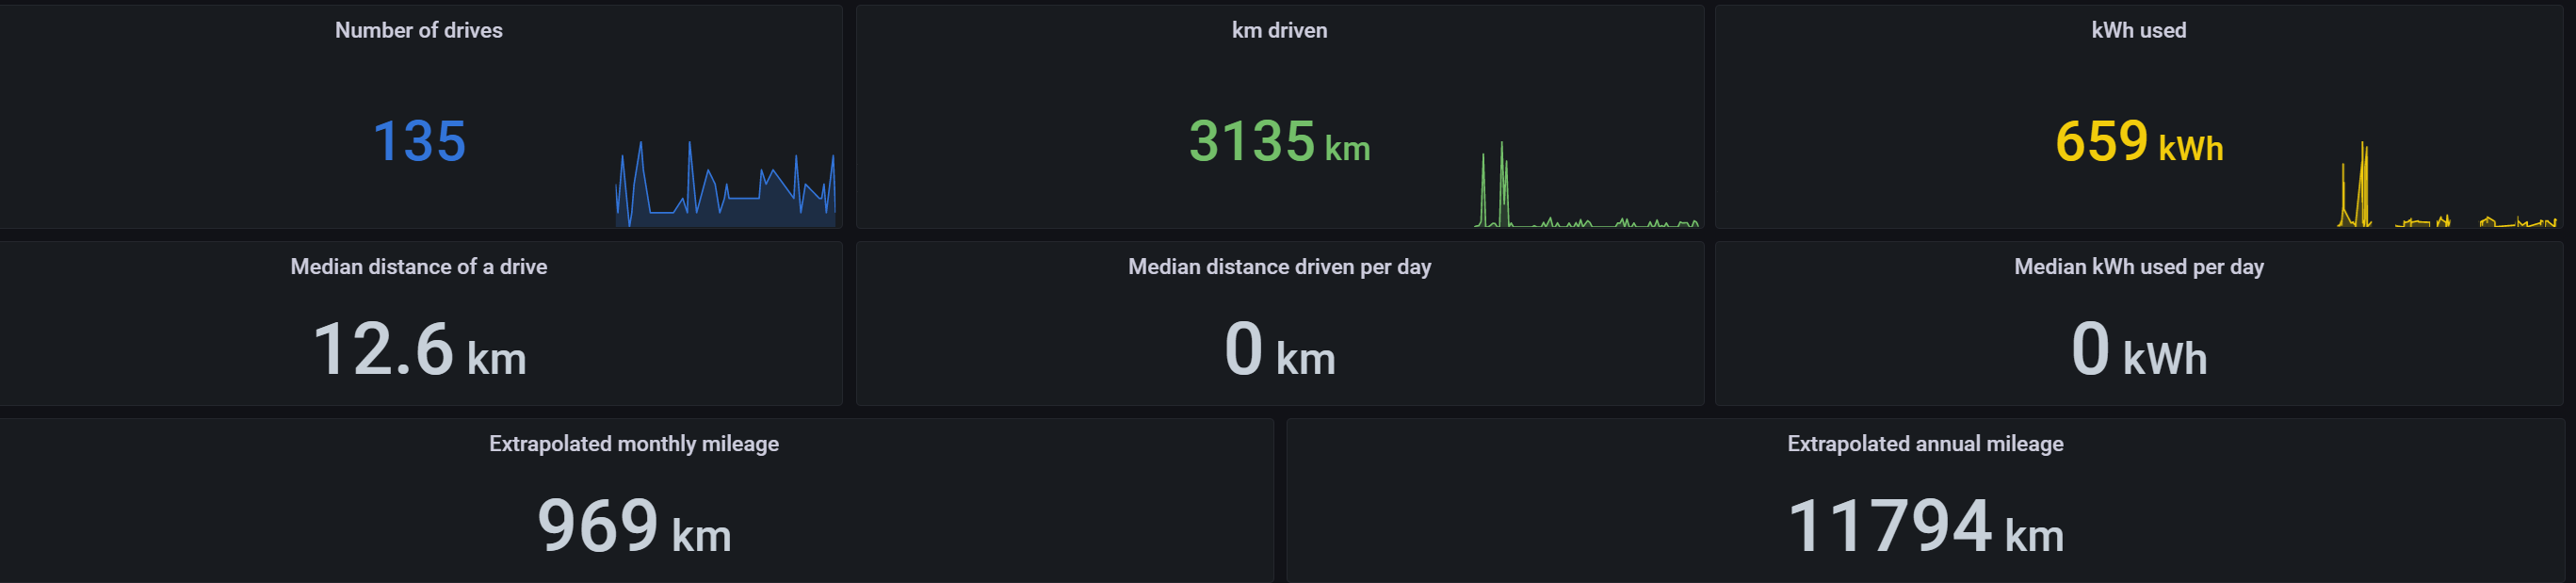
A few numbers from the Tesla Logger:
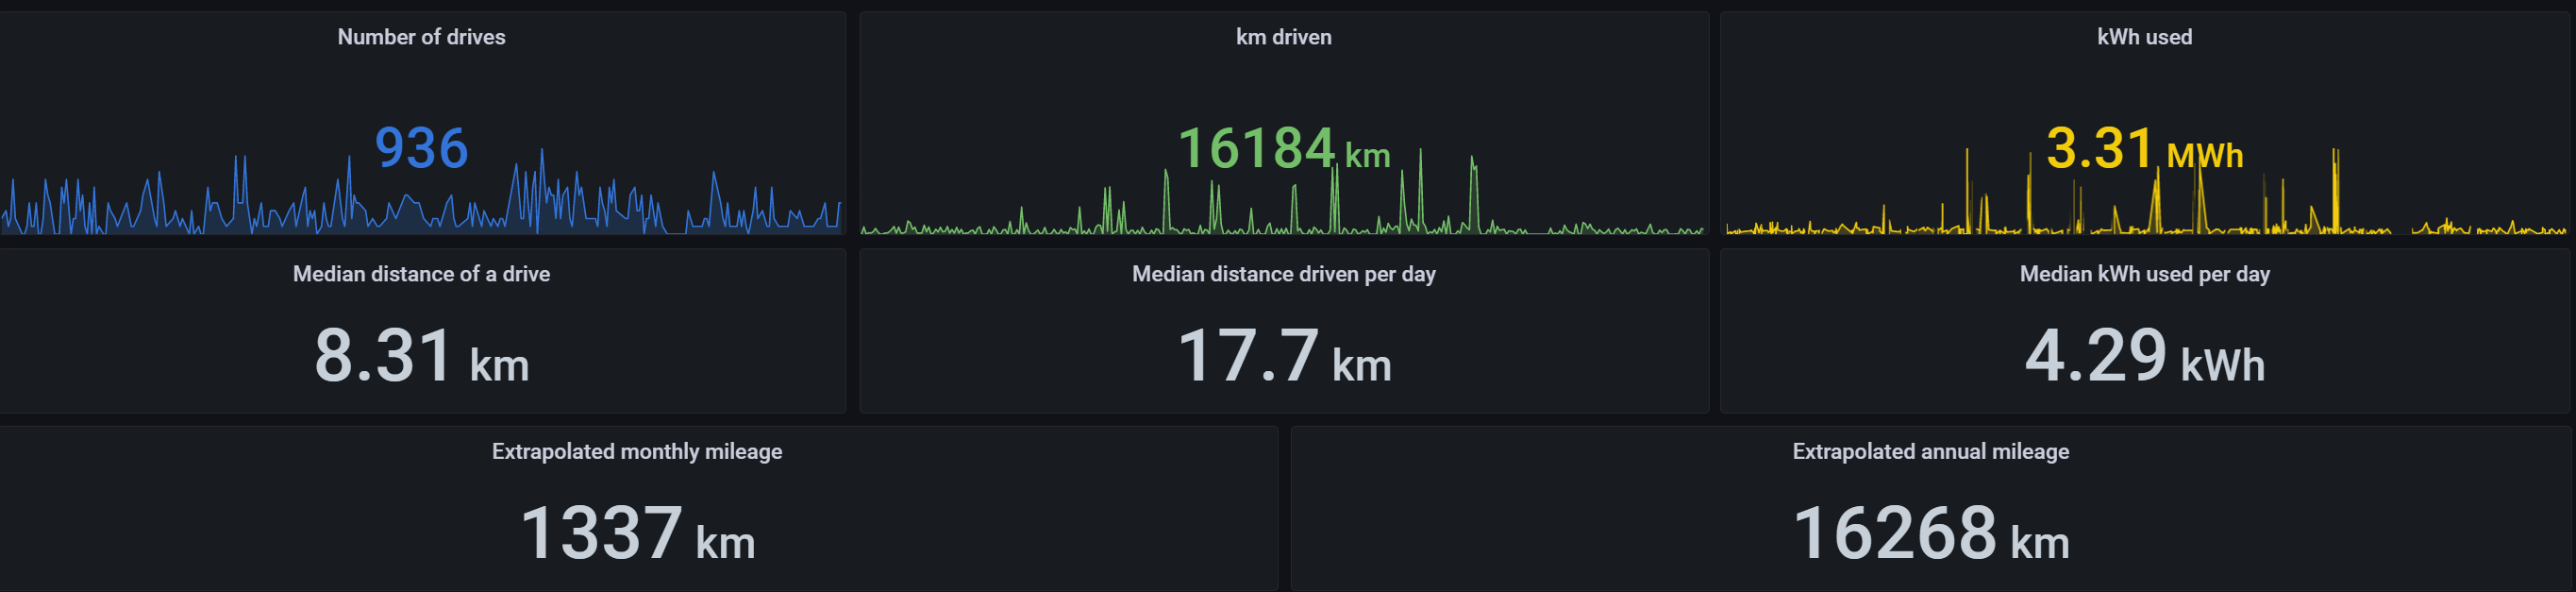
The Model 3 shows we have the perfect driving profile for EVs: only ~18 km per day on average. A meaningless average of course — most trips are to Karlsruhe and back, so more like 30–40 km.
We essentially always keep the cars at 80–90% charge (data from the last 6 months):
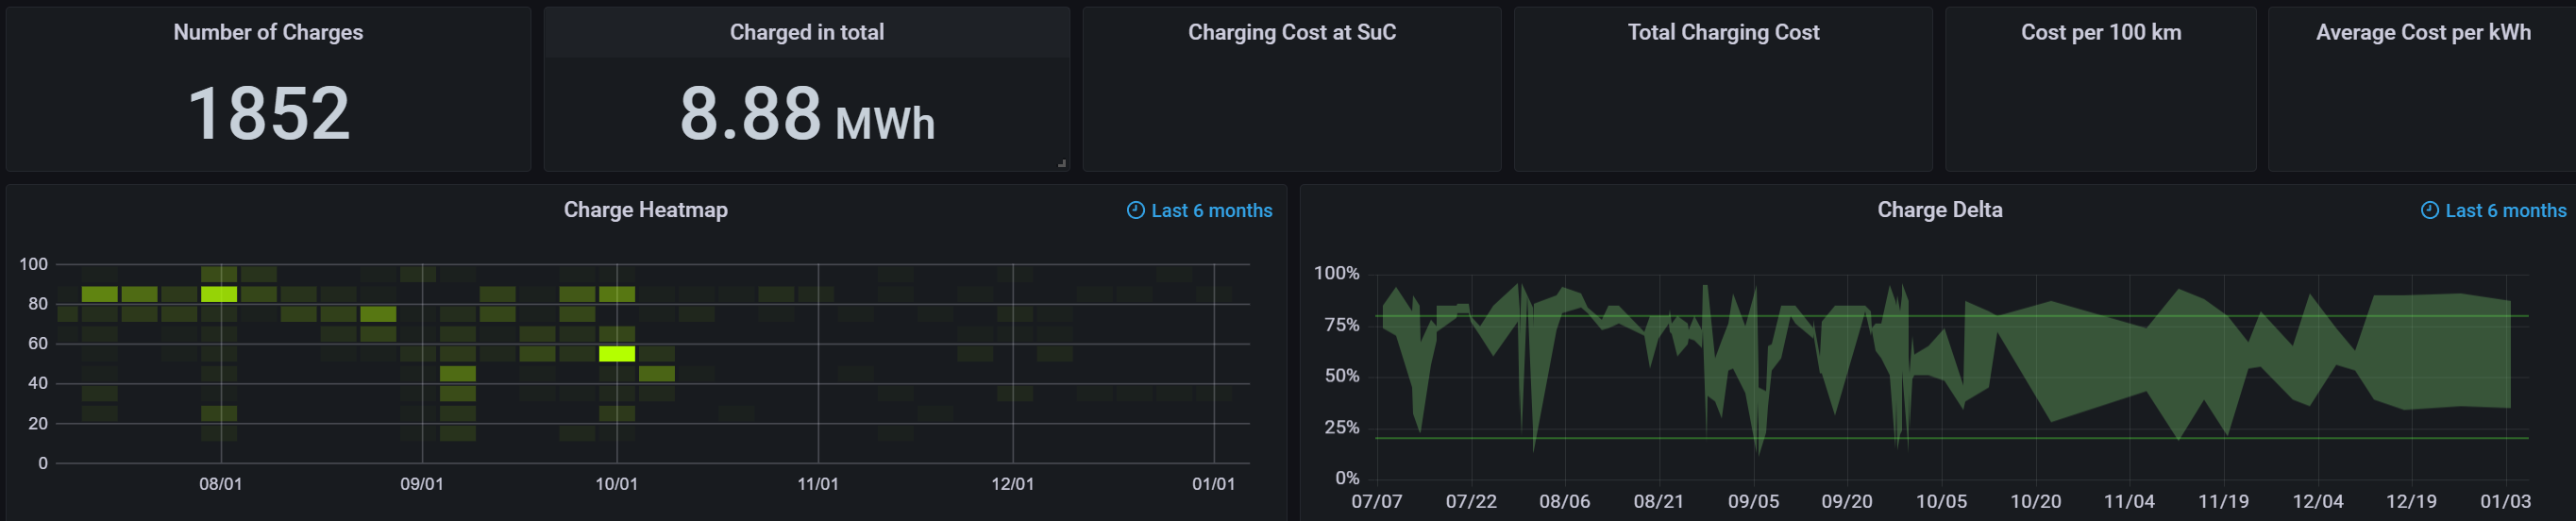
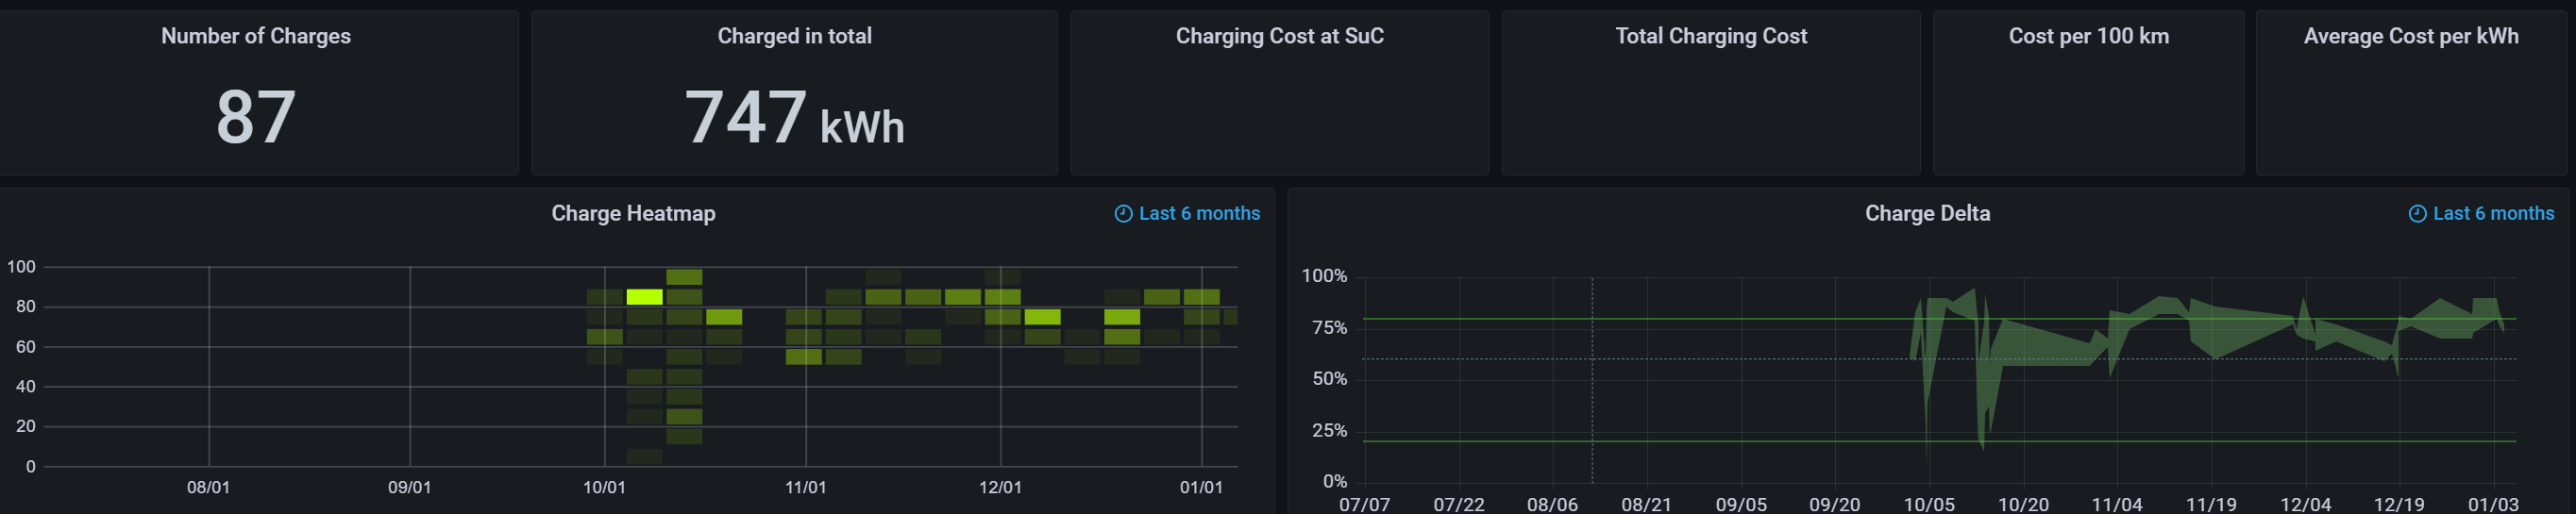
The Model Y is clearly being underused… :-) In summer you can see the long-distance trips by the larger “Charge Delta”. (A peak reaching near the 20% mark means a long trip.)
The heatmap also shows how often (= too early) we charge again — so range is genuinely not an issue. That’s also why this is the first time I’ve looked at consumption in any detail.
This is the most interesting part — it shows that you can have significantly more fun with a Tesla at lower running costs (and that’s without factoring in lower workshop costs and 4-year warranty).
The cars have been driven as follows (as of January 2023):
| Car | Distance driven | Consumption/100 km | Total consumption | Electricity cost (mix PV/home/public 0.30 EUR/kWh) | Petrol cost comparison (7l/100km, 1.80 EUR) |
|---|---|---|---|---|---|
| Model 3 | 16,184 km | 242 Wh/km | 3,916 kWh | €1,175 | €2,039 |
| Model Y | 3,135 km | 236 Wh/km | 739 kWh | €222 | €395 |
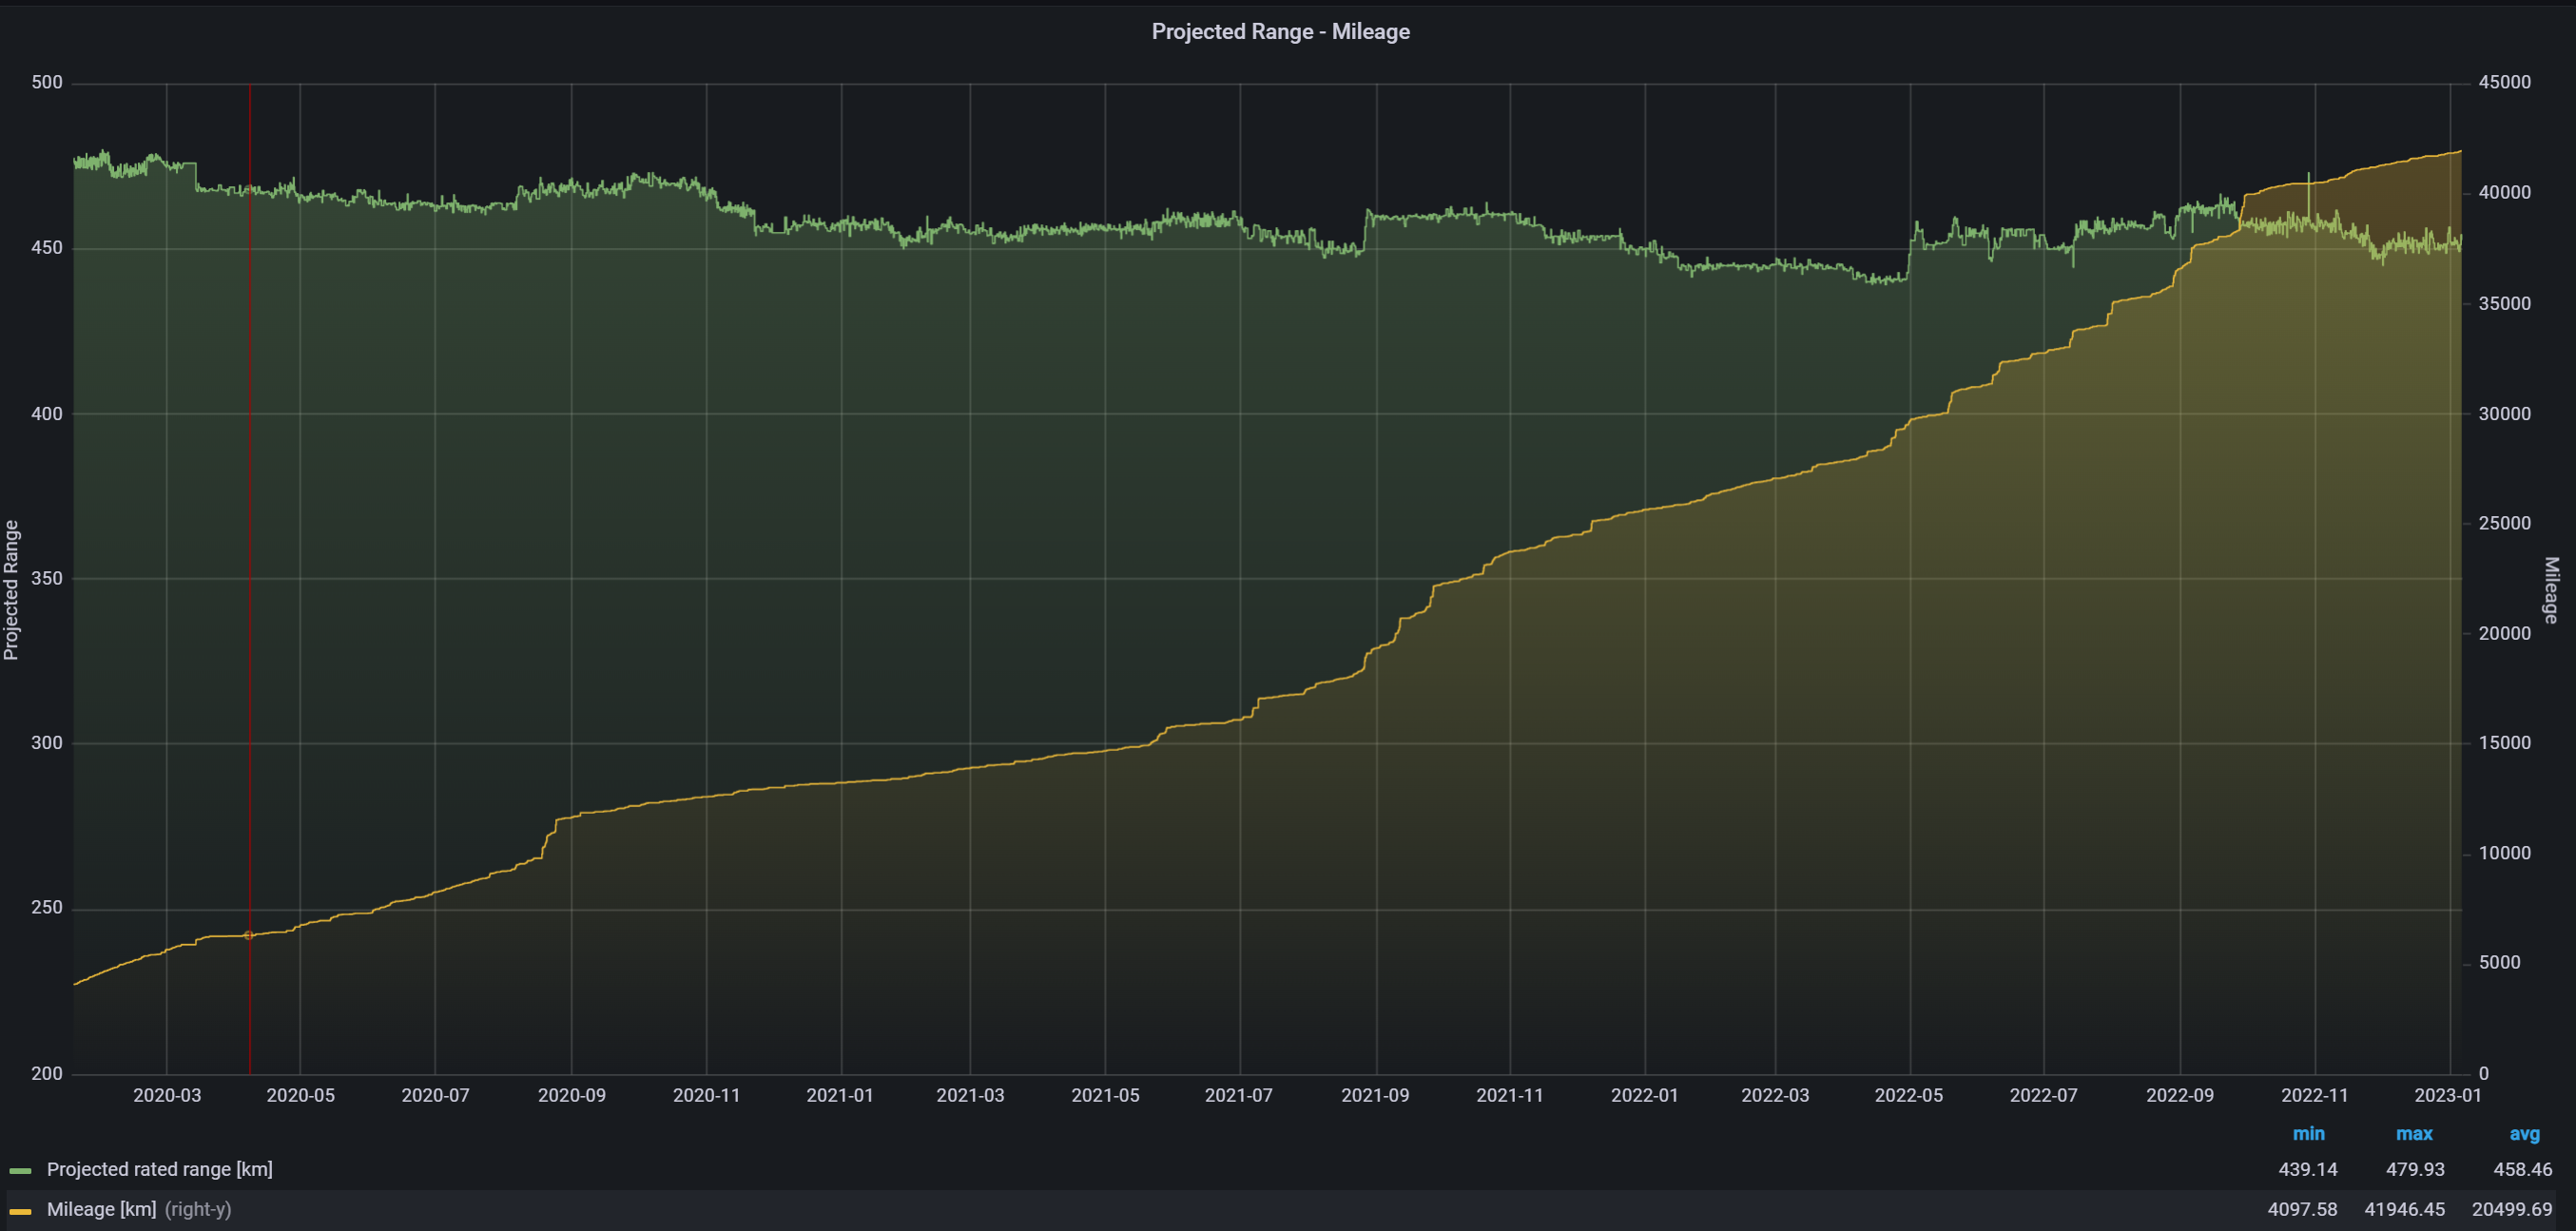
While I’m at it — many people worry about this: “How much range does a battery lose as the car ages?”
Answer: from 477 km to 452 km projected range (see image below).
So after 3 years, only 25 km less range. (That’s why it’s a good idea to avoid the smallest battery option if possible, to stay comfortable.)
Worth noting: we charge very rarely with fast DC charging (e.g. Supercharger). This protects the battery. Equally important: not charging too full (below 90%) to avoid stressing the battery.
That’s my brief summary of EV efficiency.
For questions on any topic on this site (including use on your own website), please use the contact details below.